GPS Info and Satellites
The GPS Info sheet gives you a real-time view of your GNSS position, accuracy, satellite constellation, and correction status. This is essential for verifying fix quality before collecting survey data.
- Android
- iOS
Opening GPS Info
Tap the GPS Info button on the map toolbar to open the GPS Info bottom sheet. The sheet updates in real time as new position data arrives from either the internal GPS or an external GNSS receiver.
Position Data
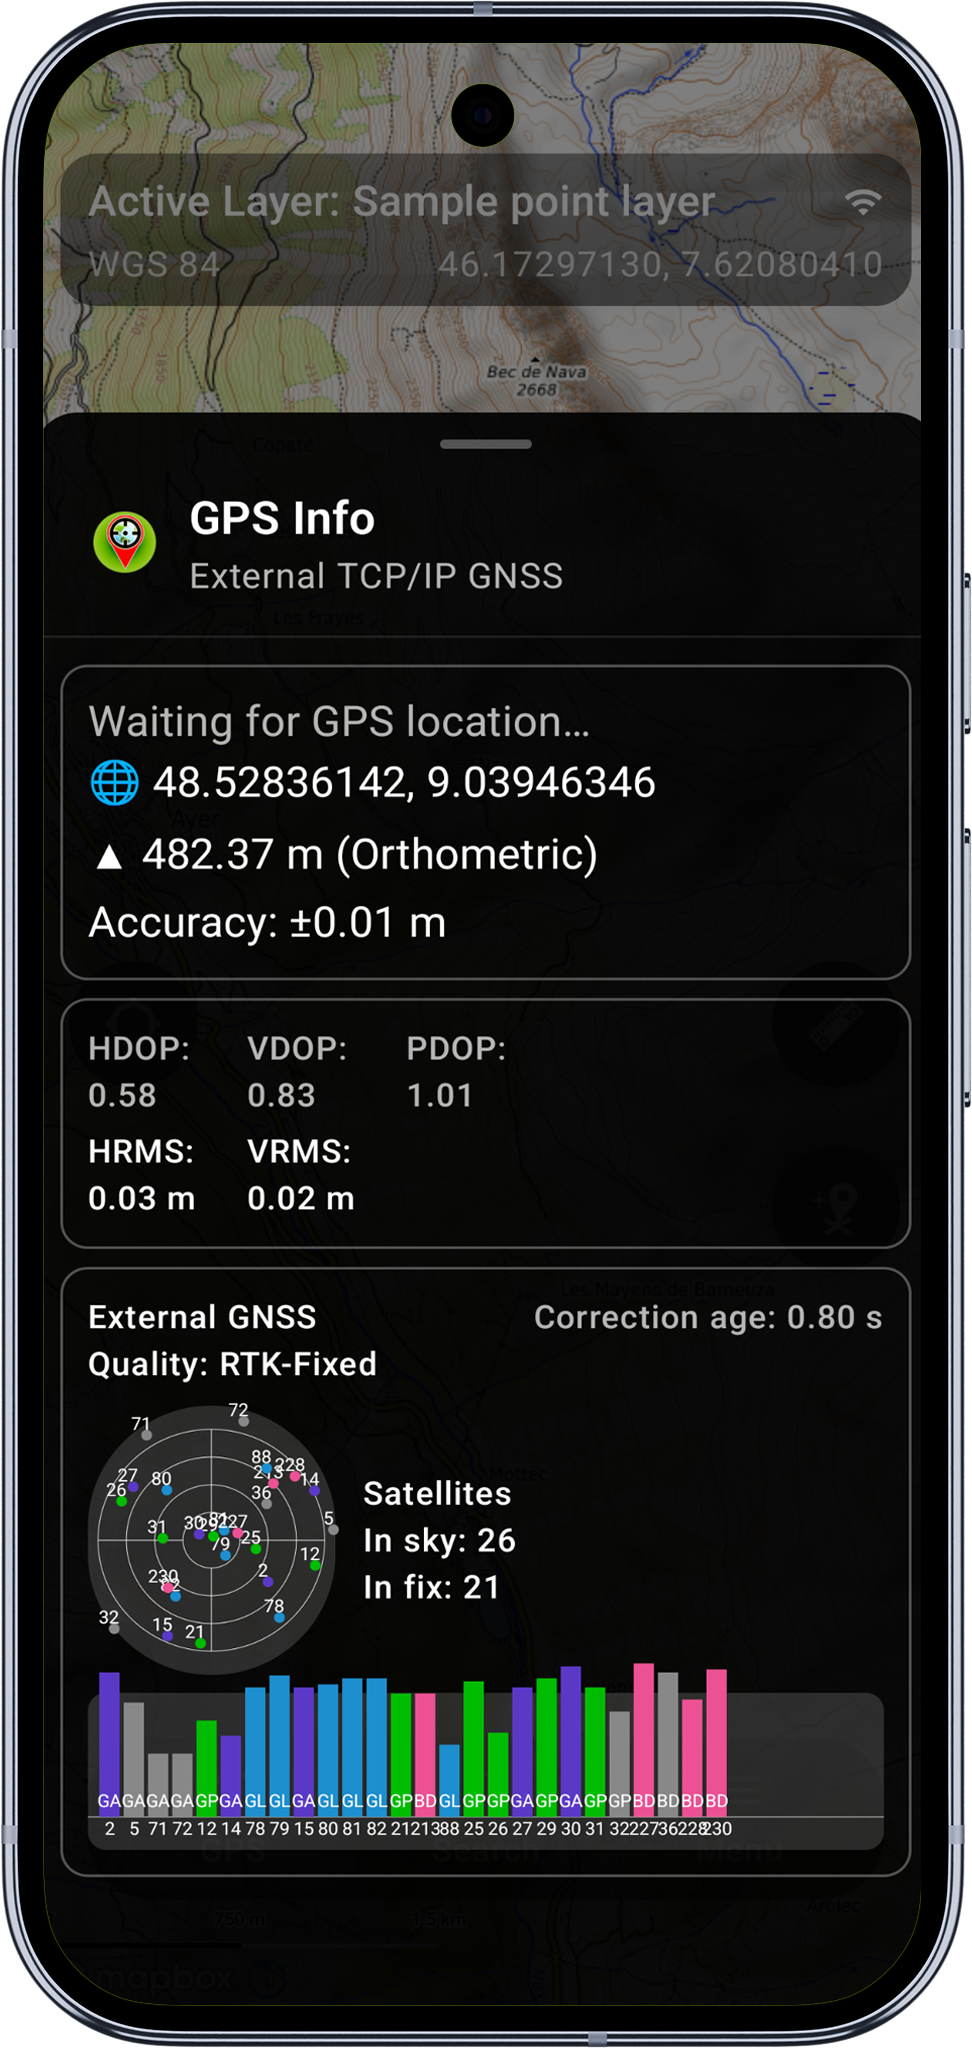
The top section displays your current position in the coordinate format configured in your project settings:
| Field | Description |
|---|---|
| Position | Latitude/longitude (or grid coordinates if a projected CRS is active) |
| Height | Elevation - ellipsoidal or orthometric depending on geoid correction settings |
| Accuracy | Estimated horizontal accuracy in metres or centimetres |
When no fix is available, the sheet displays "Waiting for GPS..." until the first valid position is received.
Accuracy Metrics
The GPS Info sheet displays the full set of accuracy and quality indicators:
| Metric | Description |
|---|---|
| HDOP | Horizontal Dilution of Precision - lower is better (< 1.0 is excellent) |
| VDOP | Vertical Dilution of Precision |
| PDOP | Position (3D) Dilution of Precision |
| GDOP | Geometric Dilution of Precision |
| TDOP | Time Dilution of Precision |
| Horizontal accuracy | Horizontal RMS error or computed accuracy |
| Vertical accuracy | Vertical RMS error |
| Fix type | Current fix quality (see RTK and Fix Types) |
| Correction age | Seconds since the last differential correction was applied |
| Correction station | ID of the reference station providing corrections |
DOP values describe the geometry of the satellite constellation, not the absolute accuracy. A PDOP below 2.0 indicates excellent satellite geometry. Values above 5.0 suggest poor geometry - consider waiting for better satellite visibility.
Satellite Information
Satellites in Use vs. in View
The sheet shows two satellite counts:
- In use - satellites actively contributing to the position solution
- In view - all satellites visible above the horizon, including those not used in the fix
Supported Constellations
Mapit GIS recognises satellites from all major global and regional navigation systems:
| System | Abbreviation | Coverage |
|---|---|---|
| GPS | GP | Global (USA) |
| GLONASS | GL | Global (Russia) |
| Galileo | GA | Global (Europe) |
| BeiDou | BD / GB | Global (China) |
| QZSS | QZ | Regional (Japan, Asia-Pacific) |
| SBAS | SB | Augmentation (WAAS, EGNOS, GAGAN, MSAS, SDCM) |
SBAS satellites (PRN 120-138) are identified separately. When PRN 123 or 136 is in use, the correction system is identified as EGNOS; other SBAS PRNs are labelled generically.
Sky Plot
The sky plot is a circular diagram showing the position of each visible satellite relative to your location:
- The centre represents directly overhead (90 degrees elevation).
- The outer ring represents the horizon (0 degrees elevation).
- North is at the top.
- Each satellite is plotted by its azimuth (compass direction) and elevation (angle above the horizon).
Satellites are colour-coded by constellation and status:
| Colour | Meaning |
|---|---|
| GPS colour | GPS satellite used in fix |
| GLONASS colour | GLONASS satellite used in fix |
| BeiDou colour | BeiDou satellite used in fix |
| Galileo colour | Galileo satellite used in fix |
| SBAS colour | SBAS augmentation satellite |
| Grey | Satellite visible but not used in fix |
| Dim | Satellite with no signal lock |
Signal Bar Chart
Below the sky plot, a signal bar chart shows the signal-to-noise ratio (SNR) for each visible satellite:
- Each bar represents one satellite, labelled by PRN number.
- Bar height corresponds to signal strength in dB-Hz (0-99 scale).
- Bars are colour-coded by constellation, matching the sky plot.
- Satellites used in the position fix are drawn with a solid fill; unused satellites appear with a lighter fill.
A consistent SNR above 35 dB-Hz indicates a strong signal. Satellites below 20 dB-Hz are unlikely to contribute to the fix. If signal levels are low across all satellites, check for obstructions (buildings, tree canopy, vehicle roof).
GPS Info Line on Map
You can display a condensed GPS info line directly on the map without opening the full sheet. Enable this in Settings > Survey Settings > Show GPS info line on map. This overlay shows position, accuracy, and satellite count as a single line at the top of the map view.
Altitude and Speed Display
Enable Show altitude and speed in Settings > Survey Settings to add real-time altitude and ground speed to the map display.
The sky plot and signal bar chart are not yet available on iOS. The GPS Info sheet displays position, accuracy, and fix type data received from any supported external source - TCP/IP, Bluetooth BLE (Nordic UART Service), or Bluetooth Classic (MFi-certified, currently Eos Arrow only).
Opening GPS Info
Tap the GPS Info button on the map toolbar to open the GPS Info sheet. The sheet updates in real time as new NMEA data arrives from the connected receiver.
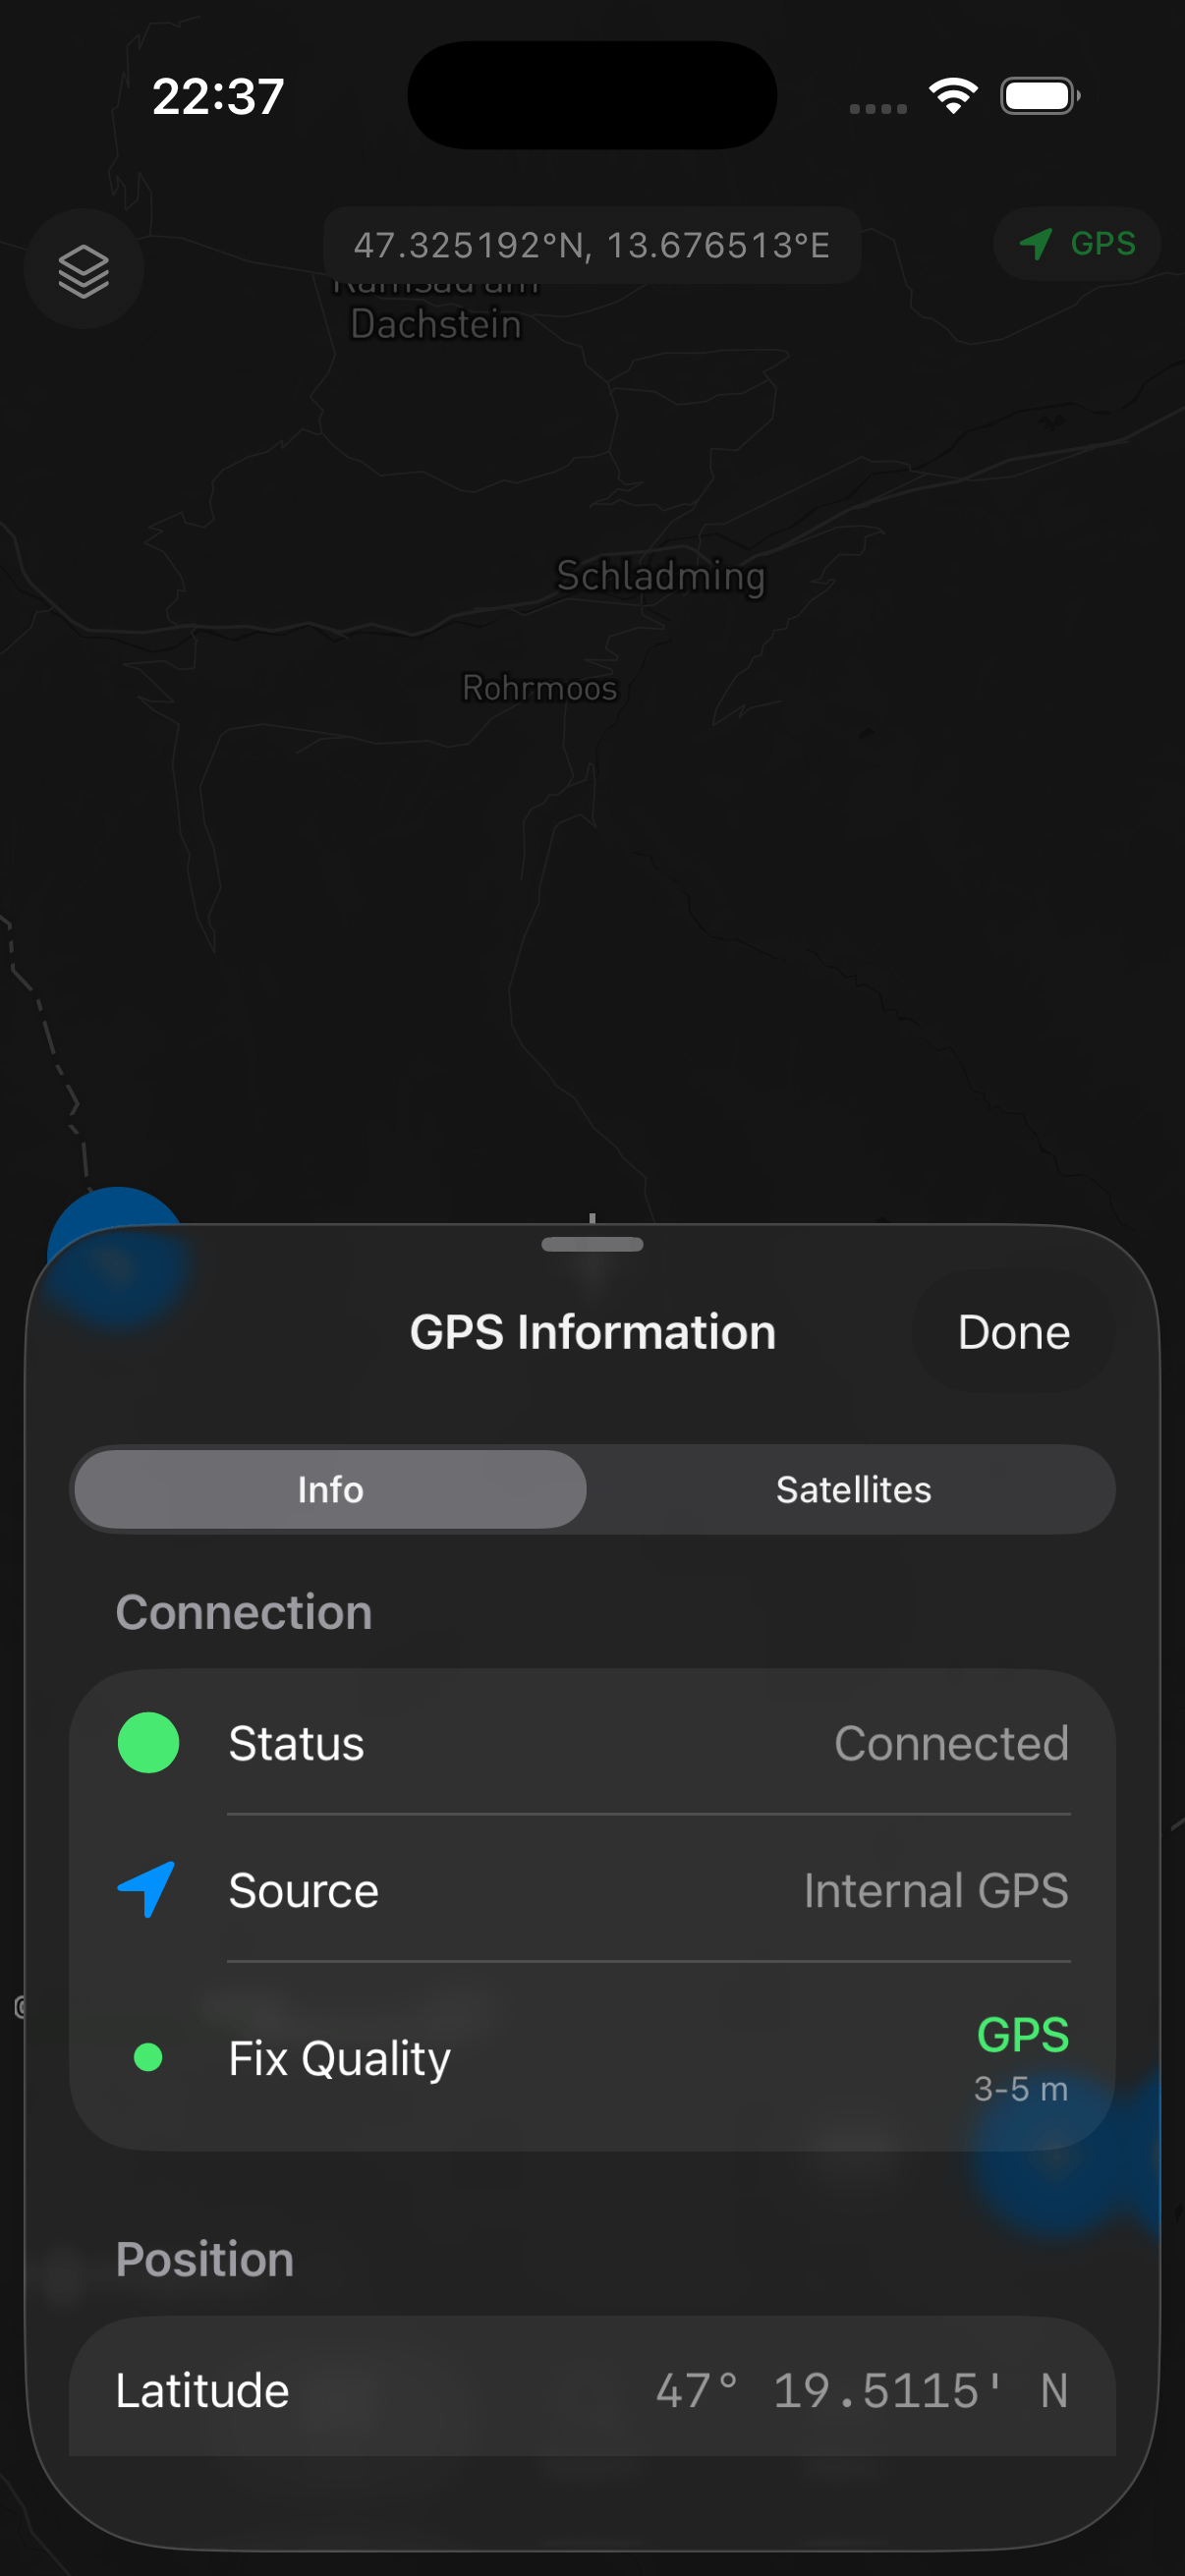
Position Data
The GPS Info sheet displays your current position in the coordinate format configured in your project settings, along with height and horizontal accuracy.
Accuracy Metrics
When connected to an external receiver via TCP/IP, the GPS Info sheet shows accuracy and quality indicators parsed from NMEA sentences, including HDOP, VDOP, PDOP, fix type, and correction age.
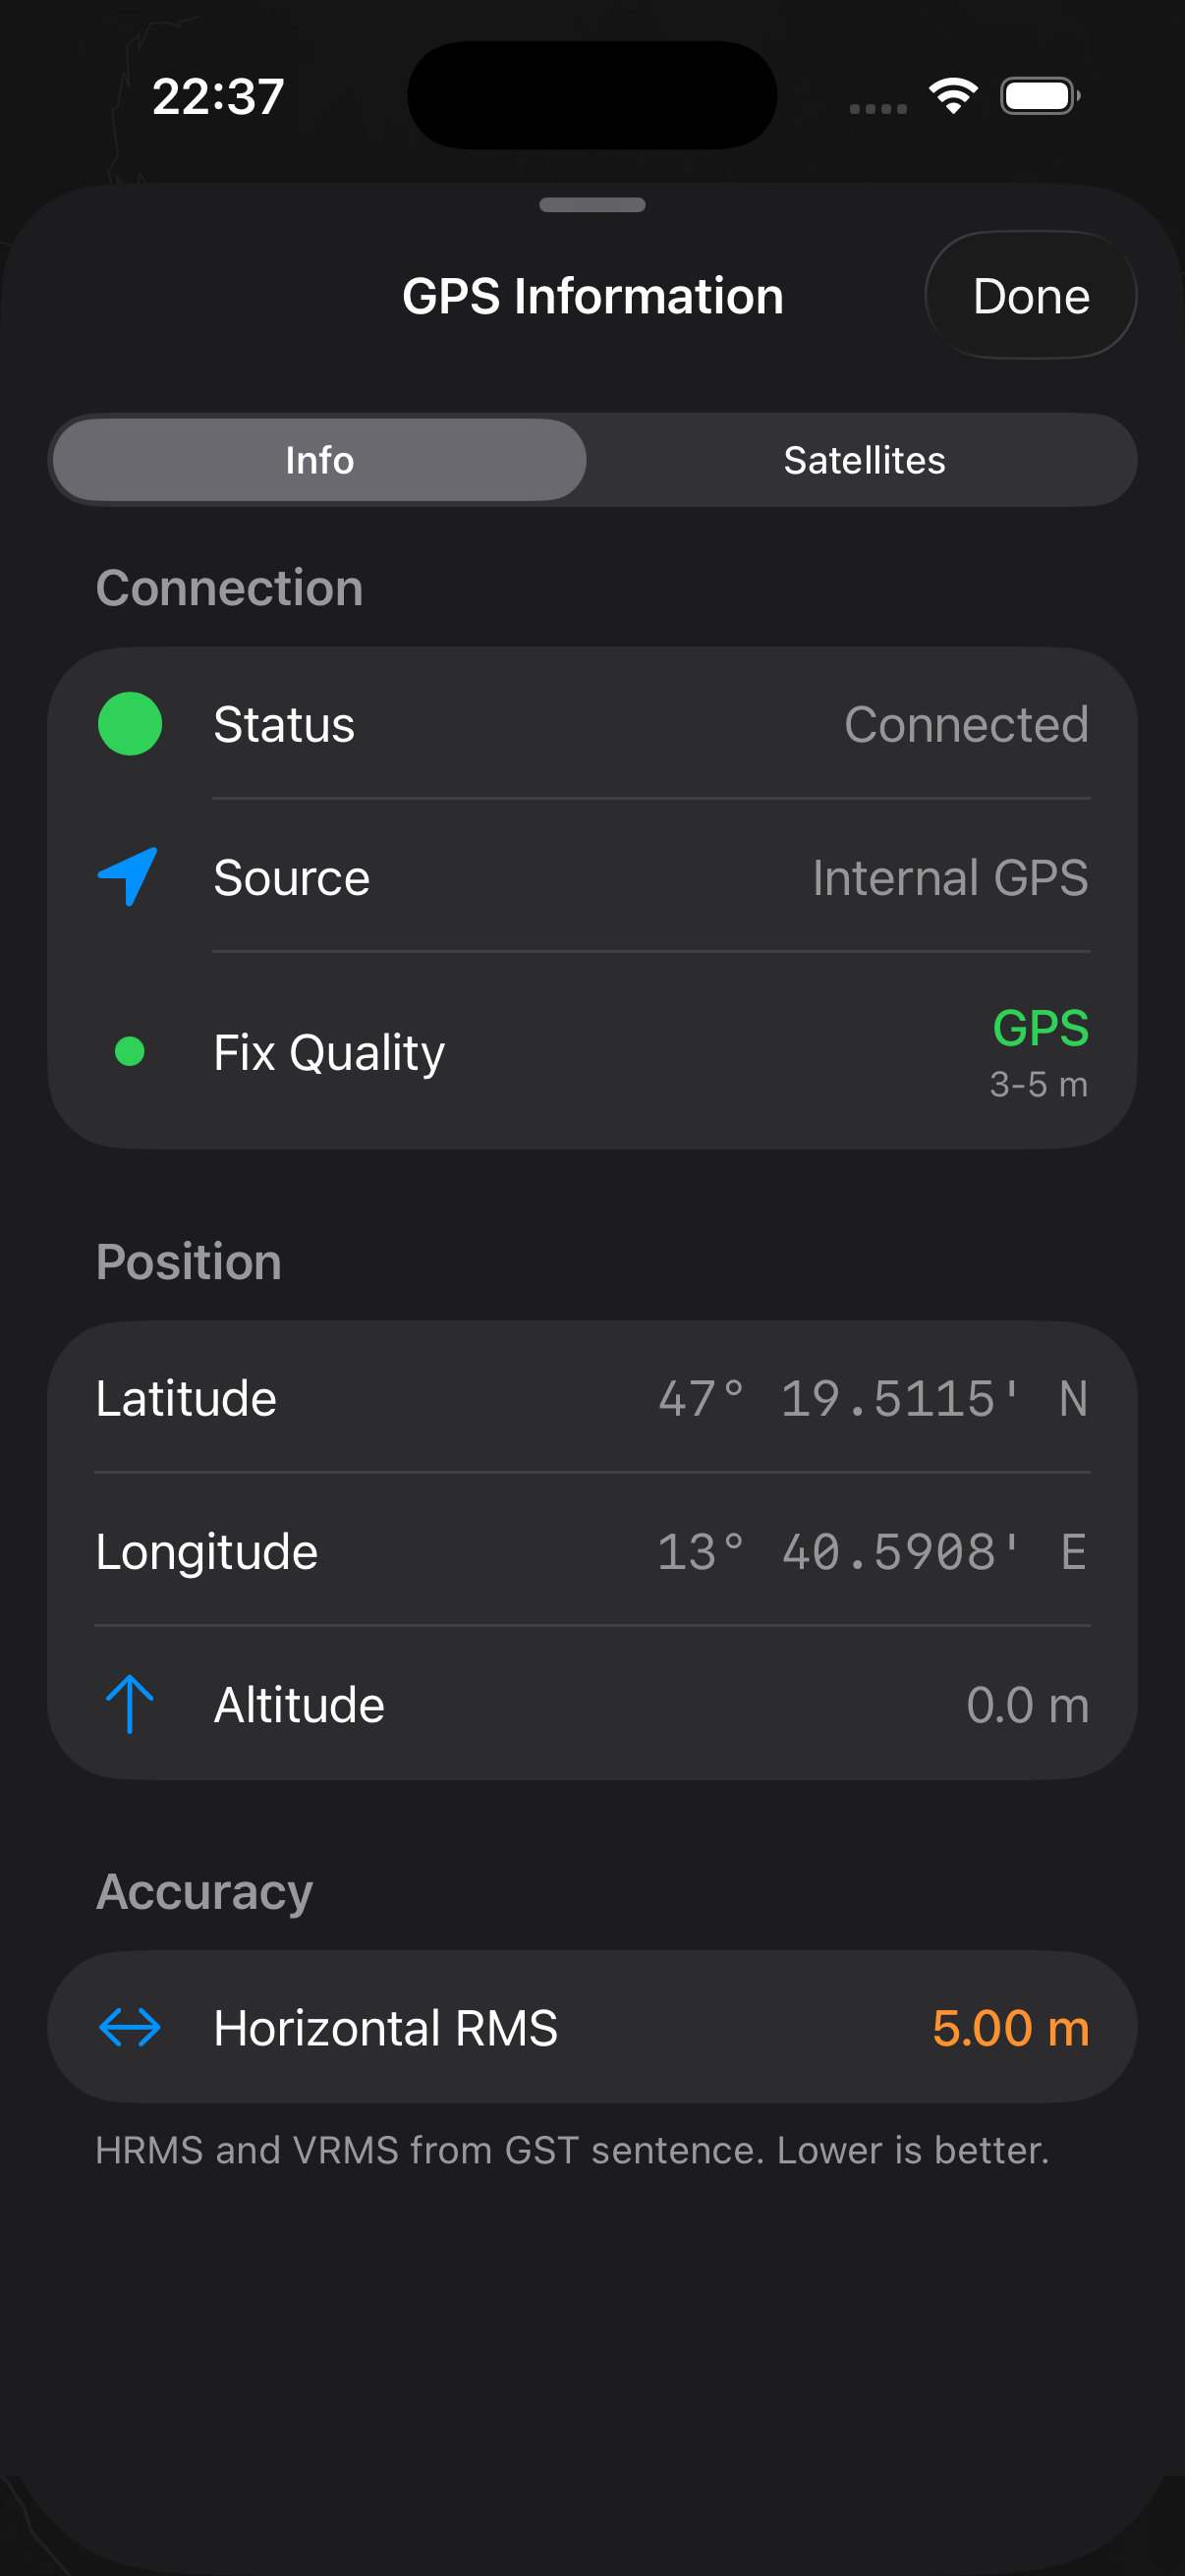
Refer to the Android tab for a full description of each metric - the values and their meanings are the same across platforms.